A watchlist, not a shopping list.
Know when a stock is stretched, before you add it to your portfolio
82 in August, 41 today. That’s when you hear from us.
Sensifty is a free Chrome extension for NSE and BSE investors. Before you buy a stock, or buy more of it, it shows how far it has run against its own history and where it has turned before, and it alerts you once when the run has cooled. Context, not a buy signal.
The market at the last close, against its own history
Loading the latest figures…
A description, not a forecast. See the history and how each is measured. Sensifty does this for each of your own stocks: add it to Chrome.
What usually happens after a stretch
Each bar is the median fall for stretches that began that month; lighter bars are still within their first year. The 500 most traded NSE stocks, . History, not a forecast. How it is measured
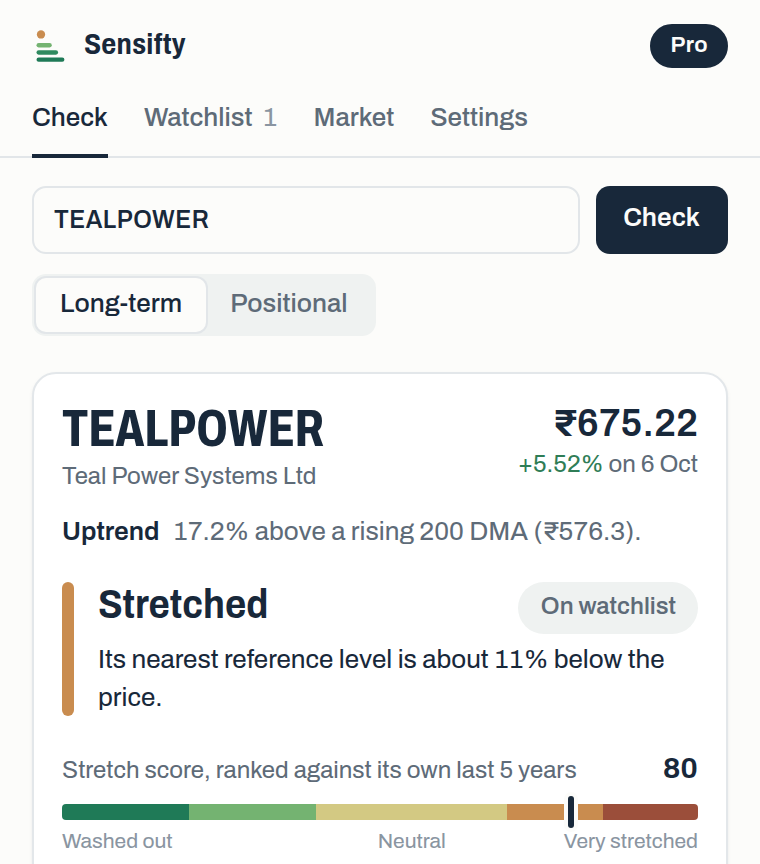
Type a symbol. Here’s what you get.
All of it is worked out from ten years of daily prices, on your own computer, in about a second.
How stretched it is
A score from 0 to 100 that compares today’s price with where the stock usually sits: against its moving averages, on RSI and within its Bollinger bands. Each measure is ranked against the stock’s own last five years, so a score of 85 means unusually extended for this particular stock, not merely above a fixed threshold.
Which way it’s heading
Whether the price is above or below its long-term average, and whether that average is rising or falling. A downtrend must hold for several sessions before it is shown, so a single weak week does not change the picture.
Reference levels from its past
Three levels, L1 to L3, where several established reference points agree, with the distance to each. They mark where the price has turned before; they are not support guarantees or targets.
Its own track record
Every past alert for the stock, free: when each stretch cooled, and how the price moved over the following one and three months. A historical record, not a forecast.
One alert. Then silence.
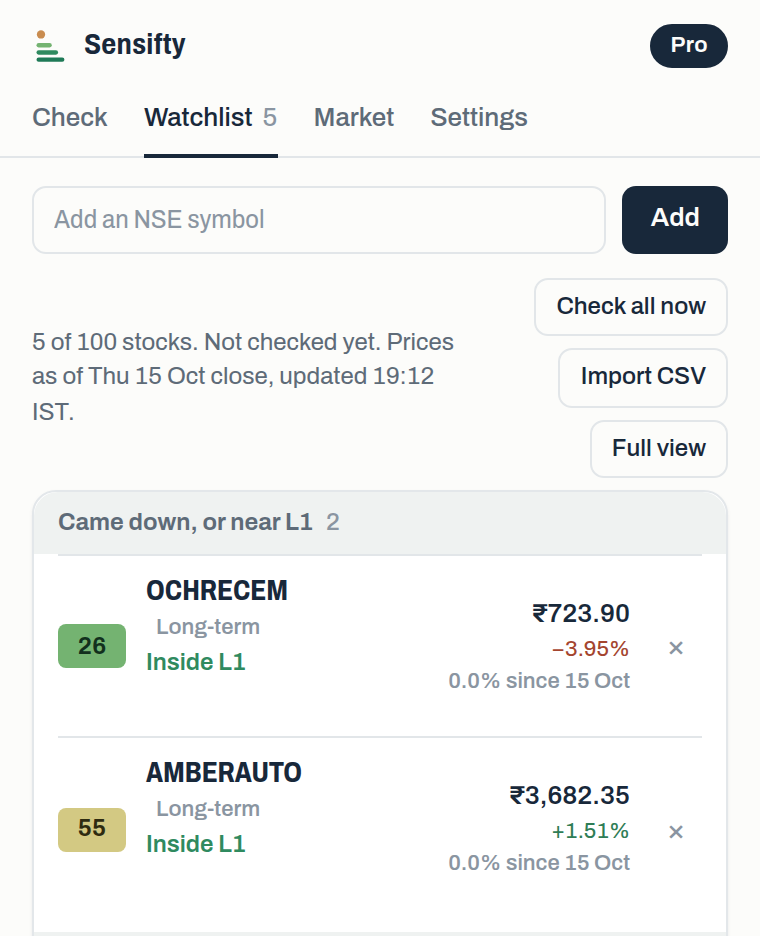
Add the stocks you are following. Each trading evening, Sensifty checks them for you. When a stretched stock reaches L1, or its score cools below 40, you receive a single notification. It then stays silent until that stock becomes stretched again. If you like, it can also tell you when a stock first becomes stretched.
There are no prices to enter, no alerts to reset and no notifications for ordinary daily moves.
In a sixteen-year test on 49 large NSE stocks, this produced two to three alerts per stock a year: few enough that each one gets read.
What it does, and what it won’t
It does
- Show how stretched a stock is against its own history
- Show where it turned before, and how far away that is
- Tell you once when a stretched stock cools off or reaches L1
- Watch your whole list with one alert setting, not one alert per stock
- Keep watching: alerts never expire, and re-arm for the next stretch
- Import your holdings from your broker in one go
- Keep your watchlist on your own computer, unless you turn on email alerts
- Show its working, so you can check any number
It won’t
- Tell you to buy, sell or hold anything
- Promise returns, or pretend the levels are floors
- Connect to your broker or go anywhere near your money
- Track you, show you ads or sell your data
- Promise you will buy cheaper: the alert marks a calmer moment, not a bargain
- Do your homework on the business for you
No crystal ball. No AI.
Sensifty uses no AI. There is no model predicting tomorrow’s price and nothing learning from your behaviour. Every figure is plain arithmetic on prices: averages, ranks and distances.
If you want to know why a score is 82, the working is shown step by step. That is deliberate: when your money is involved, you should be able to check the reasoning rather than rely on a black box.
Free, and Pro if you want more
Free
₹0
- Check any NSE or BSE stock, by symbol or name
- Watch 7 stocks, or import them from your broker
- Every past alert for a stock, with what followed
- Evening alerts on your computer, and an optional heads-up when a stock becomes stretched
- A private audit of your past buys: how stretched each stock was when you bought it
- Daily market weather
Pro
₹500 for a one-year pass, paid once
- Watch up to 100 stocks
- Alerts by email, so Chrome need not be open
- A Saturday digest of your watchlist
- Your watchlist over the past year, and context beside every score
- A 12-week sector and industry heatmap
- Advanced: alerts at L2 and L3, and the Positional view (experimental)
Try all of it free for 14 days first, with up to 25 stocks.
What testing showed, and what Sensifty is for
Before asking anyone to pay, I replayed the rules on 3,814 stretches among the 500 most traded NSE stocks from 2021 to 2024. Three results matter:
- A stretch is usually followed by a dip. 98 in 100 stretched stocks later traded below their starting price within a year, by a median of about 16%.
- It is not a timing trick. Waiting for the alert did not beat buying at once on average: a median 24.2% against 32.4% over two years, in a mostly rising market. The alert marks a calmer moment, not a bargain.
- Patience paid when the market turned. In 2024, when stretched stocks caught the top, buying in stages lost least.
So Sensifty does not promise better returns. It helps you buy with your eyes open: know when a stock is stretched against its own past, expect the dip that usually follows, and size and hold accordingly rather than be shaken out by it. Every figure, including the unflattering ones, is on the Track record page, updated monthly.
Hear when it launches
Sensifty is on its way to the Chrome Web Store. Leave your email and you get one message when it is live, and nothing else.