Stock trackers for Indian investors, compared honestly
They are less competitors than steps. Screener and Tickertape help you find and understand a business, TradingView helps you read a chart, your broker places the order, and Sensifty answers a narrower question: is this a stretched moment for this stock, against its own past?
I should say this first: I built Sensifty, so I am not neutral. What follows is my honest view of what each tool is good at, from using all of them. Their features change often, so check their own sites for the details.
And, yes I have been and I continue to be an ardent follower of the evergreen "screener" - but then again, its almost a swiss knife and that miniscule "want for more" is why I created this sensifty.!
Five tools, five questions
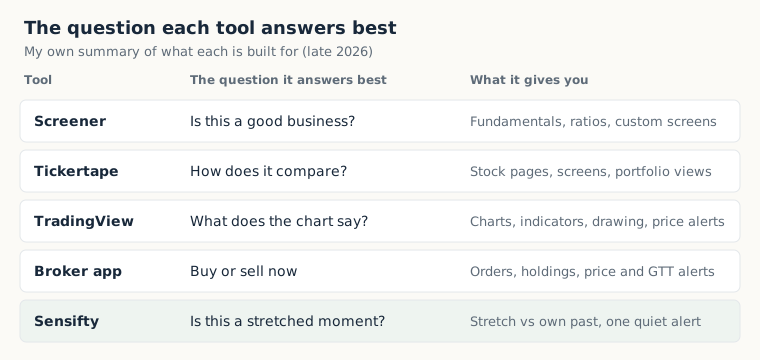
Screener is where I start with a business. Ten years of financials on one page, the ratios I care about, and custom screens written in a simple query language. It answers: is this a good business, and how has it done?
Tickertape covers similar ground with a different feel: stock pages that summarise a company quickly, screens, and portfolio views. It answers: how does this compare with its peers?
TradingView is the chart. Every indicator you have heard of, drawing tools, and price alerts. It answers: what does the price action look like? It assumes you know what you are looking for.
Your broker's app, such as Kite or Groww, is where decisions become orders. Price alerts and GTT orders live there too. It answers: buy or sell, now, at what price?
Sensifty answers a narrower question that none of the others is built around: is this a stretched moment for this stock, measured against its own last five years? And it tells you, once, when a stretch you are watching has cooled.
Where each fits
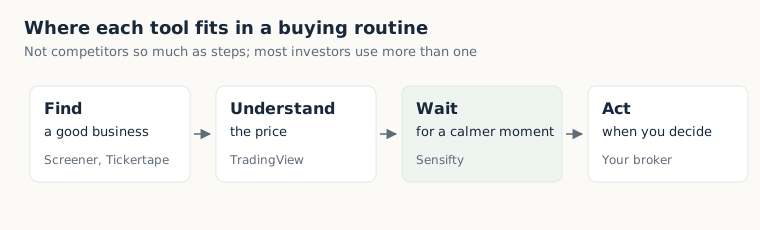
Most people I know use two or three of these. Find a business on Screener or Tickertape, look at the chart on TradingView if they care about price action, and place the order with their broker. Sensifty sits between understanding and acting: it is for the gap between deciding you like a business and deciding the moment to buy it.
Why a separate tool for that gap
Because stretches are frequent, and they are easy to miss in a list of prices.
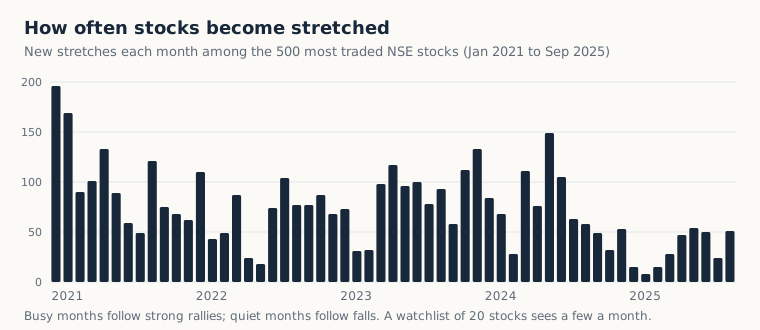
Among the 500 most traded NSE stocks, somewhere between a handful and nearly two hundred became stretched each month from 2021 to 2025. Price alerts in a broker app do not know what is normal for each stock, and an indicator on a chart has to be checked by hand, stock by stock. Sensifty does that ranking for every stock you watch, every evening.
What Sensifty is not
It does not screen for businesses, show financials, draw charts in depth, or place orders. It does not tell you what to buy. Prices are end of day, updated each evening after 19:00 IST, so it is not for watching the market move during the day. If you want those things, the tools above do them well.
Written by the person who builds Sensifty.
Sensifty is a Chrome extension for people who invest in NSE and BSE stocks. It shows how stretched a stock is against its own last five years, reference levels from its past, and sends one quiet alert when a stretched stock cools off. End-of-day data; technical information only, not investment advice. What it is · Track record