Why technicals matter even if you only invest for the long term
Technical measures will not tell you whether a business is good. They do tell you whether the price is stretched against its own past, and stretched prices usually fall back: a median of about 16% within a year, more than 30% in nearly one case in four.
For years I ignored charts. I read annual reports, picked businesses I understood, and bought when I had done the work. My view was that price movements were noise, and that technicals were for traders.
And, then you get hit hard with reality sooner or later. I love charts, arrows, boxes but definitely not the 200+ indicators. Yet again, what practical life teaches is far from the idealistic "fundamental investing"
I still think the business matters most. But I was wrong about one thing: the price you pay changes the experience of owning a good business, and technical measures are good at describing that price.
What technicals can and cannot tell you
They cannot tell you whether a company is well run, whether its debt is manageable, or what it will earn in five years. For that you need the business itself.
What they can tell you is how far today's price sits from what is normal for that stock. A moving average shows the recent trend. RSI shows how one-sided recent moves have been. Bollinger bands show how far the price is from its recent range. Each is crude on its own. Ranked against a stock's own last five years, together they give a reasonable answer to one question: is this price stretched for this stock?
That ranking matters. An RSI of 70 is ordinary for a fast-moving small company and rare for a slow utility. Measuring each stock against its own past avoids treating them as the same.
What usually happens after a stretch
I looked at 3,808 stretches among the 500 most traded NSE stocks from 2021 to 2024: each one starts on the first day a stock's score reaches 80 out of 100.
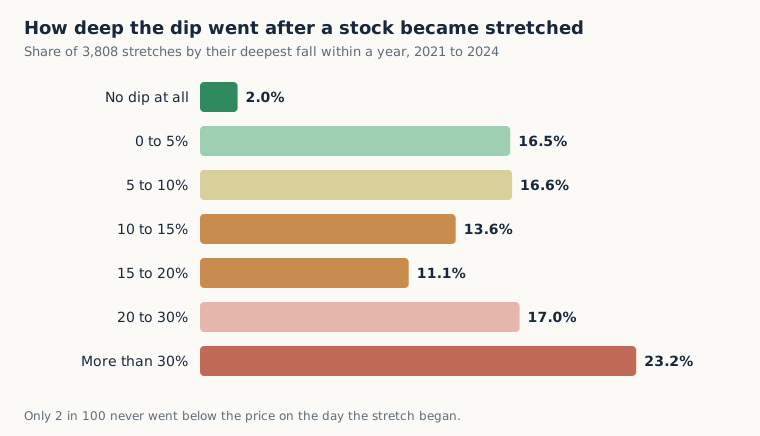
Almost all of them fell below the starting price at some point within the following year. Half fell more than about 16%. Nearly one in four fell more than 30%.
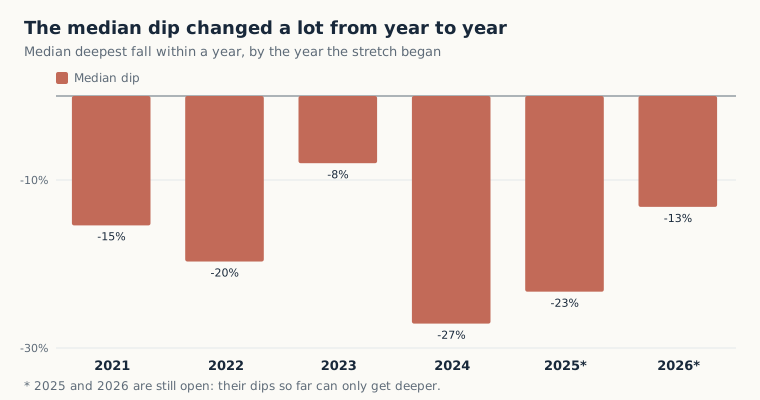
How deep depended heavily on the year. Stretches that began in 2023 dipped a median of 8%; those that began in 2024 dipped 27%. A stretched price is not a prediction of a crash. It is a sign that a meaningful dip is likely, of a size the year will decide.
Why this matters for a long-term investor
If you buy a good business at a stretched price and it drops 25% over the next few months, two things can happen. You hold, and eventually it may be fine. Or you lose your nerve and sell near the bottom, which is how good investments turn into bad results.
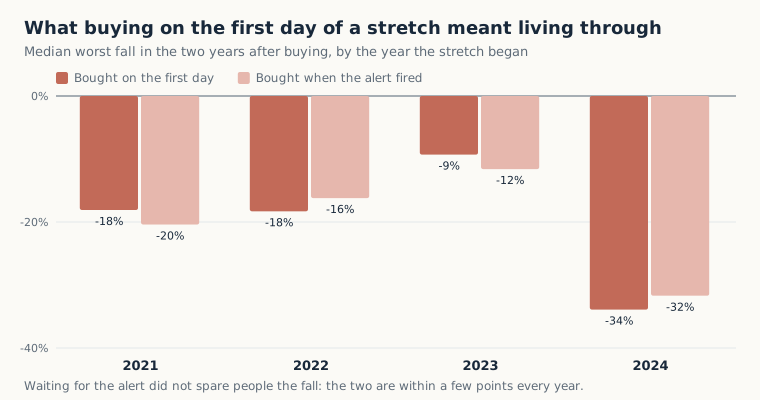
This chart is the honest part. Buying when the stretch had cooled, rather than on the first day, did not reduce the worst fall much. In 2024 both fell about a third. So technicals do not give you a way around the dip. They tell you it is likely to come, and roughly how big it tends to be, so it does not surprise you.
That is the job I use them for now: not to decide what to buy, but to know what I am walking into when I buy.
Written by the person who builds Sensifty.
Sensifty is a Chrome extension for people who invest in NSE and BSE stocks. It shows how stretched a stock is against its own last five years, reference levels from its past, and sends one quiet alert when a stretched stock cools off. End-of-day data; technical information only, not investment advice. What it is · Track record