I tested waiting for a dip on 3,800 stretched stocks. It didn't do what I expected.
After a stock first became stretched, its price fell a median of about 16% at some point within a year. But waiting for that dip did not beat buying at once: in 2021 to 2024, buying on the first day returned a median 32.5% over two years, against 24.4% for waiting.
I built Sensifty on a simple idea: if a stock has run far above its own normal, wait. It will probably come back down, and you will buy it cheaper. Before asking anyone to pay for that idea, I wanted to know whether it was true.
So I tested it on every stretch I could find among the 500 most traded NSE stocks, from January 2021 to October 2024. A stretch starts on the first day a stock's stretch score reaches 80, which means today's price ranks near the top of its own last five years. That gave me 3,808 stretches.
But then, how do I know it actually mattered? Well, that's where the testing comes. Honest test results, even though it doesn't favor Sensifty a very lot, but then why hide the truth?
Three ways to put ₹1 to work
For each stretch, I imagined ₹1 and three ways of investing it:
- Buy on the first day of the stretch.
- Wait for the alert, which fires when the stock cools off or comes back to its first reference level, and buy then. If it never comes within a year, buy at the end of the year.
- Buy a third at each reference level (L1, L2 and L3), as each is reached. Any third still waiting after a year goes in then.
Each ₹1 was valued two years after the stretch began.
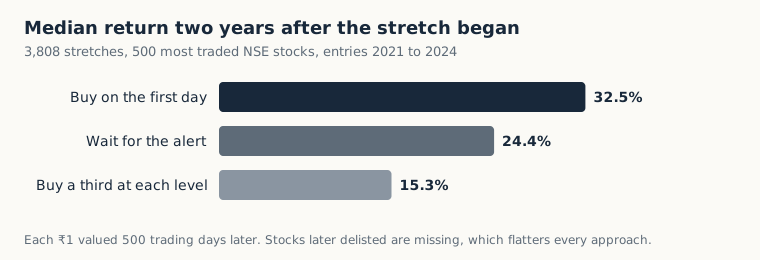
Buying at once won. Not by a little: the typical stretch returned 32.5% for buying on the first day against 24.4% for waiting. Spreading the money across the levels did worst, at 15.3%.
That was not what I expected, and I nearly did not publish it.
Why waiting lost
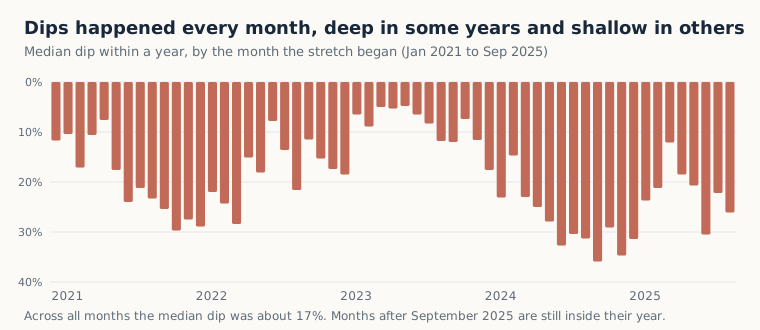
The dips were real. After a stock first became stretched, its price fell a median of about 16% at some point within the next year. Only 2 stretches in 100 never went below the starting price at all.
The trouble is timing. The alert usually fired early in the dip, when the price was only about 2% below where the stretch started, and in 43% of cases it fired at a higher price than the first day. Meanwhile the stocks that never came back down kept running, and the money that waited for them went in later and higher. In a market that mostly rose, those runaway stocks cost more than the dips saved.
The year mattered more than the method
Split by year, the picture changes.
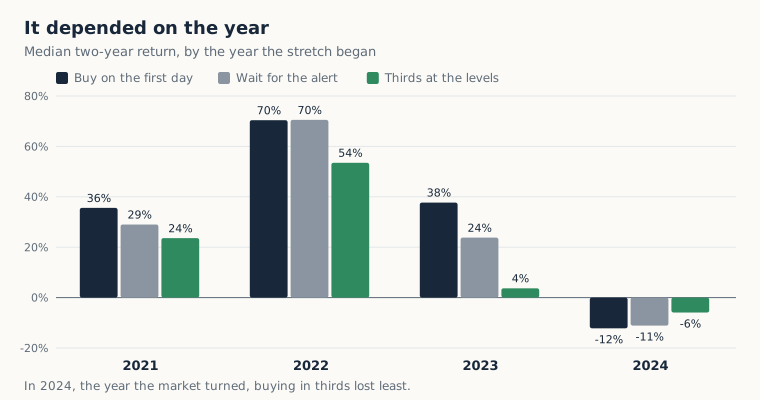
In 2021 and 2023, buying at once was clearly better. In 2022 it made almost no difference. In 2024, when stretched stocks caught the top, every approach lost money, but buying a third at each level lost least: a median 5.9% against 12.2%. The deeper levels earned their keep in the one falling year.
What about waiting for a deeper level?
I also tested alerts at deeper levels: 10% below the start, L2 and L3.
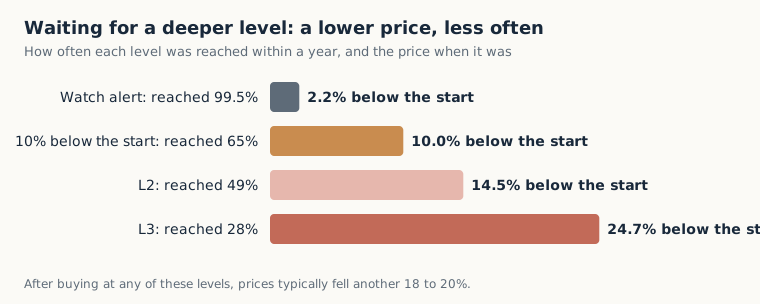
The deeper the level, the lower the price when it came, and the less often it came at all. L3 bought about 25% below the start, but only in 28% of stretches. And after buying at any of these levels, prices typically fell another 18 to 20%. A deeper level gets you a lower price, not a calmer ride.
What I changed because of this
I stopped describing Sensifty as a way to buy cheaper. It is not, on average. What it does well is tell you how stretched a stock is against its own past, and remind you once when the stretch has cooled. That is a tool for patience and context, and the numbers above are on the Track record page, refreshed every month, including the parts that do not flatter it.
Written by the person who builds Sensifty.
Sensifty is a Chrome extension for people who invest in NSE and BSE stocks. It shows how stretched a stock is against its own last five years, reference levels from its past, and sends one quiet alert when a stretched stock cools off. End-of-day data; technical information only, not investment advice. What it is · Track record